In October 1913, the United States broke with a solid 124-year-old protectionist tradition and enacted the Underwood-Simmons Tariff Reduction Act, lowering import tariffs by an average 5.1 percentage points. Eight months later, in June 1914, World War One was triggered; but nobody ever thought of blaming America’s flirtation with “free trade” for the Great War.
In June 1930, the United States enacted the Smoot-Hawley Act that raised import tariffs by an average 3.6 percentage points. The stock market had already crashed eight months earlier, in October 1929, triggering the Great Depression. Yet there are people who to this day blame the Great Depression on the “protectionism” of the supposedly protectionist Smoot-Hawley Act that took effect long after the Great Depression had begun.
Raising tariffs does not cause depressions, any more than lowering tariffs causes war.
The only reason that this empirical truth may not be obvious is the pervasive conventional wisdom of recent decades that views even the slightest questioning of the establishment’s free trade agenda as a threat to prosperity and a possible trigger of global depression.
Global GDP growth, though still positive, is declining for the third year in a row. Global export growth has been negative since Q3 2014 as shown in the graph below:

But blaming the global economic slowdown on shrinking world trade is putting the cart before the horse and makes the discovery and articulation of pro-growth economic policies more difficult. But that is a story for another time.
For now let’s merely dispel the twin myths that trade protectionism by itself is the enemy of economic growth and that free trade by itself promotes growth. We need to do this because the entire world economic and trading order is about to be renegotiated top to bottom if and when the US electorate puts Donald Trump in the White House.
There is overwhelming historical evidence that links protectionism with rapid growth, especially in US economic history:
- Alexander Hamilton’s Tariff Act of 1789 launched the United States as an unapologetically protectionist economy with a 15% average ad valorem tariff imposed “for the encouragement and protection of manufactures.” Between that year and 1827, the average annual GDP growth rate was 4.5%.
- The 1828 Tariff Act (dubbed “Tariff of Abominations” by the slave-owning southern United States) raised tariffs dramatically (to a 25% ad valorem rate and to 50% on dutiable items). Between 1828 and 1857, this high level of tariffs was maintained virtually intact. The average annual GDP growth rate soared to 5.3% for the 30-year period.
- The Tariff Act of 1857 reduced tariffs to 15%-18% ad valorem for four years until 1861, during which time the average annual GDP growth rate collapsed to 1.8%.
- The 1861 Morrill Tariff raised tariffs initially to 26% overall ad valorem and 36% on dutiable items. These were later raised to 38% and 48%, respectively, and inaugurated an era of high protectionism that lasted until 1913. That was the year in which the US became the world’s largest exporter, surpassing Great Britain and Germany. For the half century from 1861 to 1913, the average annual GDP growth rate was 4.53%.
- The 1913 Underwood-Simmons Tariff reduced rates to 26% on dutiable items and to 12.5% overall ad valorem. The effect of these tariff reductions on GDP cannot be estimated because the First World War intervened. During the war years, GDP growth average 15% but was fueled by a fivefold increase of federal debt. (In the Second World War, with much higher tariffs, GDP growth averaged 16.2% with only a twofold increase in debt).
The end of the First War was followed by an economic depression in 1920-22, with a GDP decline of 17% from $88.4 billion to $73.4 billion. That depression ended suddenly and sharply, partly as a result of aggressive protectionist measures.
- The September 1922 Fordney-McCumber Tariff Act raised the tariff of dutiable items to 39% (from 26%) and the overall ad valorem tariff to 14% (from 12%). What followed was the era of the Roaring Twenties from 1922 to 1929, with an average annual GDP growth rate of 5.7% and a huge reduction of the federal debt. The massive growth that followed these 1922 tariff hikes took place despite the fact that America’s trading partners retaliated with massive tariff hikes of their own.
- The notorious June 1930 Smoot-Hawley Act, the supposed harbinger of all sorts of Great Depression evils, had much less of a bite than the 1922 Fordney-McCumber tariff hike: by 1935, the overall average ad valorem tariff was 15.6% (up from 14% in the previous tariff regime). Moreover, it can be argued that Smoot-Hawley was enacted by President Hoover as a defensive reaction to boycotts and rate hikes against American exports promoted by foreign governments before Congress passed Smoot-Hawley.
After the end of the Second World War, the US led the liberal reorganization of world trade under the Bretton Woods Agreements (IMF and GATT). The US opened its hitherto protected domestic markets to imports from war-torn Europe and Japan, at the same time allowing those destroyed economies to raise protective barriers against US exports until such time as their economies recovered.
A succession of American import liberalization agreements throughout the postwar era correlated with declining US GDP growth rates: From 1946 to 1994 (NAFTA enactment), US GDP growth averaged 3.2% per year. From 1994 (NAFTA enactment) to 2015: US GDP growth averaged 2.4% per year.
At first, in the 1950s and 1960s, easier access to American markets enabled the recovery of the European economies. It won the Europeans over to the idea of “free trade,” understood unilaterally as free access of European products to American markets without necessarily an equivalent European obligation.
Afterward, in the 1970s and 1980s, easier access to American markets enabled the recovery of the Japanese economy. It won the Japanese over to the idea of “free trade,” once again understood unilaterally as free access of Japanese products to American markets without necessarily an equivalent Japanese obligation.
Finally, in the 1990s and 2000s, easier access to American markets enabled the recovery of the Chinese economy. It won the Chinese over to the idea of “free trade,” again understood unilaterally as free access of Chinese products to American markets without necessarily an equivalent Chinese obligation.
These unequal trade arrangements were undertaken by the United States as tools of a deliberate grand national strategy aiming to create a US-led global liberal order based on economic prosperity. The assumption was that generous US market access conditions would give rise to democratically run, liberal free market societies in Europe, Japan and China whose prosperity would lead them eventually to open their own markets to American entrepreneurship.
This was a mistaken assumption. Yes, generous access to American markets created prosperity in Europe, Japan and China. But no, the prosperity did not lead to democratically run, free-market societies in Europe, Japan and China. And no, their markets have not opened up to American entrepreneurship.
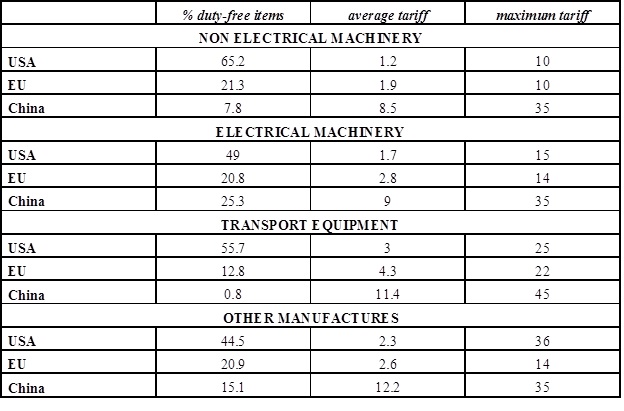
The unequal application of free trade principles at the expense of the United States is evident by a simple perusal of the tariff schedules published by the World Trade Organization. (https://www.wto.org/english/res_e/booksp_e/tariff_profiles15_e.pdf ). For example:
America’s generous postwar trade policy has failed to create a balanced world economy, and that dangerous imbalance has its most dangerous expression in large, perennial and unsustainable US trade and current account deficits.
These deficits exist because in Europe, Japan and China postwar American policies inadvertently gave rise to policy elites whose political survival depends on maintaining trade surpluses. Their continued socio-political rule depends on policies designed to protect the vested economic interests of their exporters – the very same exporters whose existence was made possible by America’s generous postwar trade policies.
In short, America’s adoption of free trade policies for itself in the seventy years since the Second World War gave rise to protectionist vested interests in the societies of its trading partners. Today, the more that the US continues on the same free trade path the more it will encourage protectionism abroad and the worse that the global imbalances will become.
Global trade and investment relations must be renegotiated from scratch. That is not easily done. Last time it happened was in the aftermath of world war.
At any rate, if and when such comprehensive negotiations will be forced on humanity’s agenda, the ivory tower theoretical abstractions of comparative-advantage based free trade theory will play no role. As always, the raw power of competing economic interests will determine their outcome.
And one last thought: Adam Smith’s and David Ricardo’s comparative-advantage free trade theory was aimed against 16th-17th century stagnant-technology-based mercantilism. The 18th century Hamiltonian advancing-technology-based protectionism proved that it promotes economic growth faster than the Smith-Ricardo free-trade model.

Brilliant Synopsis!!
LikeLike
good one Criton hope all is well
will call you soon al
LikeLike
Interesting post, thank you.
LikeLike
Unless the BLS is smoking funny stuff, 3 years ago their statistics indicated Canada and Mexico
amounted to 85% of our trade. Well after, of course, the start of NAFTA. Which makes me think
why should I care about China and the EU?
Re immigration: We all know we’re not replacing ourselves. I see the only way out for us is more
working people who produce the next hardworking generation. The huge problem with this is the
vetting ability of the Gov’t. Angela Merkel is illustrating the type of political problem immigration
produces.
I give.
LikeLike
China and the EU (and less so Japan) are the main source of global imbalances: Our merchandise trade deficit with China+EU is 70% of our total deficit whereas the deficit with Canada+Mexico is only 10%.
LikeLike